Imagine trying to draw a detailed map of a city while you’re standing right in the middle of it.
Sounds impossible, right?
This is the same challenge astronomers face when trying to figure out the shape and structure of our home galaxy, the Milky Way.
Now, Professor Keith Hawkins from The University of Texas at Austin has come up with an exciting way to get around this problem.
He’s using a technique known as chemical cartography or chemical mapping to uncover parts of the Milky Way that we’ve never seen before!
His research has been published in the Monthly Notices of the Royal Astronomical Society, and it promises to revolutionize our understanding of the Galaxy.
So, what’s chemical cartography? In simple terms, it’s like drawing a map of the Galaxy using chemical markers instead of relying solely on starlight.
It helps astronomers see where different elements from the periodic table are spread out across the Milky Way, which can give clues about where different stars and other celestial objects are located.
Thanks to more powerful telescopes, scientists like Hawkins can now create detailed chemical maps of the Milky Way.
“It’s like being an explorer, creating better and better maps of our world, but in this case, our world is the entire Galaxy!” Hawkins said.
For decades, we’ve known that the Milky Way is a spiral galaxy, but figuring out the exact shape, structure, and even the number of its arms is tough because we’re stuck in the middle of it all.
As Hawkins explains, “It’s like being in a big city. You can see what street you’re on, but it’s hard to know what the whole city looks like unless you’re in a plane flying above it.”
Traditionally, astronomers have tried to map the Milky Way by looking for places where there are lots of young stars.
This is because the spiral arms of the galaxy are where new stars are born. But sometimes, clouds of dust can hide these stars, making some parts of the Milky Way difficult to map.
That’s where chemical cartography comes in. It relies on a property called “metallicity,” which is the ratio of metals to hydrogen on a star’s surface. In astronomy, anything that isn’t hydrogen or helium is considered a “metal”.
Younger stars have more metals because they formed later in the universe’s history, when more metals were present.
In the very beginning, after the Big Bang, the universe only contained hydrogen, helium, and tiny amounts of a few metals.
The first generation of stars fused hydrogen and helium into more complex metals in their cores, and when they exploded or died, these metals were thrown out into space. They then became the building blocks for the next generation of stars.
So, over time, each generation of stars has more metals than the last one, meaning they have higher “metallicity”. As a result, the spiral arms of the Milky Way, which are full of young stars, should have higher metallicity than the regions between the arms.
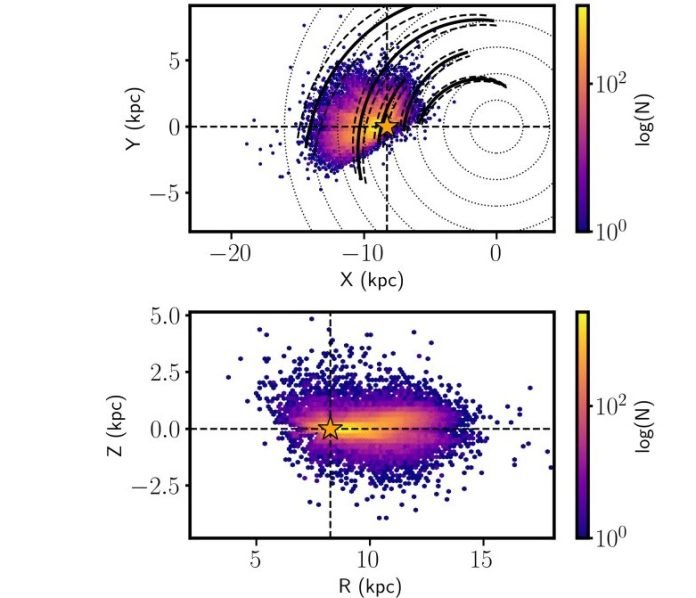
For his research, Hawkins used data from the Large Sky Area Multi-Object Fibre Spectroscopic Telescope (LAMOST) and the Gaia space telescope.
His map showed the distribution of metallicity in the Milky Way, and sure enough, the areas with more metals matched up with the spiral arms of the galaxy.
His technique even revealed some previously unknown regions of the Milky Way’s spiral arms. “The spiral arms are indeed richer in metals. This shows how valuable chemical cartography is for understanding the Milky Way’s structure and formation. It could totally transform our view of the Galaxy,” said Hawkins.
This is only the beginning, though. The Gaia space telescope has already provided data on around two billion objects and will continue to reveal more of the Milky Way’s secrets.
As new telescopes come online, astronomers like Hawkins will be able to use chemical cartography to better understand our home Galaxy, and by extension, other galaxies and the universe as a whole.
As Hawkins puts it, “It’s a completely new era.” So, the next time you look up at the night sky, remember that we’re all part of a vast and complex cosmic map that we’re only just beginning to chart!
Follow us on Twitter for more articles about this topic.


